Research Article - (2016) Volume 4, Issue 5
Diabetes mellitus affects more and more people in poor areas of developing countries. The search for an adequate treatment and within the reach of the population has moved us to select the leaves of Ocimum gratissimum. Phytochemical screening was carried out on one hand, detecting major groups of secondary metabolites, on infused 10% aqueous and on the other hand minerals salt in point microanalysis dispersive spectrometry. Toxic test was carried out using white mice CF1 type. The phytochemical screening revealed the presence of saponin, sterol and terpenes, alkaloid polyphenols, tannins and flavonoids and especially mucilage. The amounts of total polyphenols and total flavonoids were respectively 11.98 mg EAG/g and 3.99 mg EQ/g of dry extract. The phytochemical screening revealed moisture content of 8.97%, total ash of 8.45%, sulfuric ash of 10.27% and ash insoluble in hydrochloric acid 0.96%. The presence of Cu, Zn, K, Ca and Mg having an important role in glucose metabolism was revealed. The study of acute toxicity showed that the toxic dose could be greater than 3000 mg/kg. Also, the leaves are eaten as human food by some people. The results of the studies indicated that the leaves of Ocimum gratissimum contains minerals and bioactive secondary metabolites that, in combination, may explain their therapeutic uses for treating diabetes mellitus.
Keywords: Ocimum gratissimum; Minerals; Phytochemistry
Herbal medicines are increasingly used for the treatment of metabolic diseases including diabetes. This pathology is spreading at an alarming rate worldwide [1]. Diabetes mellitus is a disease commonly found in all communities, especially those living in developing countries. Diabetes mellitus is steadily increasing and that represent a serious threat to the economy and total discomfort to those suffering from diabetes [2]. The global prevalence of diabetes in 2008 was estimated at 10% of adults’ population over 25 years [3]. The estimated global incidence of diabetes in 2013, and the projection for the year 2035 as given by the International Diabetes Federation (IDF) is 592 million [4].
The World Health Organization (WHO), in its resolution AFR/RC50/R3 August 31, 2000, recommended and encouraged research and the use of medicinal plants especially in countries where access to modern medicine and conventional treatment is difficult. Also, the drugs of modern medicine may have significant side effects. So the search for antidiabetic medicinal plants used traditionally and with little side effects and toxic free has been undertaken by some researchers N'Guessan [5] and Tra et al. [6] in 2008. The Ocimum gratissimum (Lamiaceae) was selected because of its known properties and its availability to many people in tropical and subtropical regions of Africa, India and Southeast Asia. The plant produces an essential oil, volatile, stored in its leaves and stems. This essential oil is a component of several medicinal preparations [1]. Also, this essential oil is active against several species of bacteria including Escherichia coli and fungi including Trichophyton rubrum [7]. Traditionally, Ocimum gratissimum is used in the treatment of sinusitis, pharyngitis, flu, colds, common cold and canker sores [8]. The leaves of this plant species have coagulant, anti-diarrheal, analgesic and spasmolytic [9,10]. This drug also has an anti-hyperglycemic activity in rats’ plasma and in human blood [9,11]. So, based on the latter activity of this medicinal plant, this study aimed at finding the chemical constituents responsible for its’ anti-hyperglycemic activity in order to use the drug in the treatment management of people having type 2 diabetes.
This study required technical equipments including appliances and organic solvents to carry out the drug tests.
Technical equipment
This material was supplied by Fisher Scientific (France). It includes a knife grinder Retsch SM 200 type, an oven Memmert brand, adjusted at 800 degrees Celsius, a SELECTA brand sand bath, double boiler Memmert type, a portable laboratory scale Sartorius type, a dryer borosilicate, porcelain capsules flat bottom with spout, an energy dispersive spectrometer coupled with a scanning electron microscope with variable pressure D.C/A.C. (FEG SEM Zeiss Supra 40 VP), an X-ray detector (Oxford Instruments), a microanalyzer platform EDS (Inca Cool Dry, without liquid nitrogen).
Solvents and reagents
The phytochemical screening of the drug required the use of distilled water, organic solvents and reagents. These are sodium acetate, hydrochloric acid, gallic acid, sulfuric acid, sulfuric acid, hydrochloric alcohol, isoamyl alcohol, ammonia, anhydride acetic, chloroform, ferric chloride, magnesium shavings, formalin, gallic tannin, methanol and quercetin. These reagents and solvents are supplied by Prolabo (VWR, France). They are analytically pure.
Collection of the herbal drug
The herbal drug was the leaves of Ocimum gratissimum L. It was collected in February 2012 in Abengourou, eastern region of Ivory Coast. The drug has been identified by the National Centre of Floristic (CNF) of the University of Félix Houphouët-Boigny. In this floral center, herbal drugs were tagged with the references “Abengourou, February 2012, Fofié n° 02 retained for reference purposes.
Drying and extraction
Drugs were dried in the shade at room temperature and sprayed with crusher Retsch type. Part of the powdered drug has been used for the phytochemical analysis and for the determination of minerals salt composition. The other part was used to prepare an aqueous infused 10%. An aliquot of this infused served to determine for the total polyphenols, total flavonoids. The rest of the extract was used to determine its safety.
Phytochemical screening by color reactions in tube
The methods used for gratissimum Ocimum L. leaves characterization tests are limited to the detection of large chemical groups with systemic reactions, very sensitive even with a small quantity of drugs. They are only indicative value [12]. The results were classified: Positive reaction: +; abundant: ++; Negative reaction: -.
Searching for polyphenols by ferric chloride test (FeCl3)
Polyphenols are compounds which have several phenol groups. Colorimetry phenols highlights, complex formation (selective complexassions) with ferric ion. The coloring of the complexed ion is greenish, blackish-blue or blackish-brown.
Procedure: From each aliquot were taken two mL and was added one drop of alcoholic solution of 2% ferric chloride. Ferric chloride in the presence of polyphenol derivatives produces the appearance of a greenish, blackish-blue or blackish-brown color.
Searching for tannins through the test of Stiasny
The tannins are composed of two subgroups the gallic tannins derivative of gallic acid and combined as hydrolysable glycosides, and tannins catechin non hétérosidique kind which are formed of catechols polymers condensed form. Their characterization is done by the Stiasny reagent (mixture of formaldehyde and concentrated hydrochloric acid). Catechin tannin, (in condensed form, not hydrolyzed) is precipitated as a brown flake by heating and cooling, whereas gallic tannins (hydrolysable glycosides) are hydrolysed after addition of sodium acetate. The addition of a few drops of 3% FeCl3 give a greenish color or specific blue-black color to polyphenols indicating the presence of gallic tannins.
Procedure: Searching for catechin tannins (Stiasny reaction): Evaporate each extract to dryness in a 5 mL capsule. Add to residue 15 mL Stiasny reagent. Keep the mixture in water bath at 80°C for 30 min. Let cool. The observation of precipitates in large flakes in this solution characterizes the catechin tannins (tannins not hydrolyzed).
Searching for gallic tannins: Filter each previous solution. The filtrate was collected and saturated with sodium acetate. The addition of 3 drops of 3% ferric chloride d causes the appearance of an intense blue-black coloration indicating the presence of gallic tannins (hydrolysable tannins) not precipitated by the reagent Stiasny.
Determination of flavonoids by Shibata reaction
Flavonoids are yellow pigments widely distributed in plants. They exist as glycosides which genin drift benzogammapyrone core. Their characterization is done after hydrolysis with hydrochloric alcohol solution. The action of magnesium ion on the genin, results in the formation of a compound: cyanidin chloride which has a pink-orange color or red-purple.
Procedure: evaporate each solution to dryness in a 2 mL capsule. After cooling, obtain the residue with 5 mL of hydrochloric alcohol (1:1 v/v). Pour the solution into a test tube and add 2 to 3 magnesium shavings (complexing agent flavonoids). The orange-pink or violet observed indicate the presence of flavonoids. The addition of 3 drops of isoamyl alcohol intensifies this coloring.
Searching for free quinone substances or combined by the reaction of Borntraëger
Characterization of quinone substances is based on the fact that they give under the action of an alkaline solution (aqueous ammonia, soda, lime water) a cherry red color. The test consisted of proceeding immediately to the hydrolysis of genins to characterize the total quinone substances.
Procedure: In a capsule, evaporated to dryness, 2 mL aliquot of each. Triturate the residue in 5 ml of hydrochloric acid 1/5. In a test tube, bring the solution, a half hour, a boiling water bath. After cooling on a cold water stream, extracting the hydrolyzate with 20 mL of chloroform in a test tube. Collect the chloroform phase in a test tube and add 0.5 mL of Borntraeger reagent (ammonia diluted to one half). The appearance of a color ranging from red to violet indicates the presence of quinones.
Searching for sterols, steroids and terpenes by Liebermann reaction
In the presence of concentrated sulfuric acid or Liebermann reactive, sterols and terpenes give a red-brown color.
Procedure: The extract hot and dry aliquot was obtained by acetic anhydride 1 mL chloroform (1: 1 v/v). This solution was divided between two test tubes numbered 1 and 2. In the test tube 2, 0.5 mL of concentrated sulfuric acid was poured along the wall of the tube very carefully. The appearance at the interphase of a purple or purple ring indicates a positive reaction.
Searching for saponosides
The saponins dissolve in water. They form a persistent foam solution by stirring. This property of saponosides solutions is used to highlight their presence.
Foam index = (1/ n°tube) × 100
Procedure: In a series of 10 test tubes of 16 mm diameter and 16 cm height and each numbered from 1 to 10, the aliquots were divided successively from 1 to 10 mL. These volumes were adjusted in each tube to 10 mL with distilled water. Each tube was shaken in lengthwise for 15 seconds at 2 shakes per second (30 agitations). After 15 minutes, the foam height was measured in each tube. The tube in which the height of the foam was persistent and equal to 1 cm indicates the value of the foam index according to the following report, with no the number of the tube.
Searching for alkaloids
Alkaloids have the property of combining with heavy metals (iodine, bismuth, mercury) and precipitates as colored heavy salts. The Dragendorff reagent (reagent potassium iodobismuthate) was used for their characterization.
Procedure: In a capsule, 6 mL of each solution was evaporated to dryness. The residue was taken up by 6 ml of alcohol at 60°C in a test tube. In the presence of 2 drops of Dragendorff reagents, it appears precipitates or red-orange color.
Searching for mucilage
Characterization of mucilages is through the action of alcohol. Thereof in the presence of ethanol, form flakes which precipitate.
Procedure: 1 milliliter (mL) of each aliquot, in a test tube, was mixed with 3 mL of methanol at 60 alcoholic degrees. After stirring, flocculent precipitate indicates the presence of mucilage in the drug.
Measurement
The presence of various secondary metabolites gives us the possibility of assessing the value of the drug. That of moisture content gives storability and the ash content makes it possible firstly to assess the extraction rate and partly to the presence of inorganic compounds.
Total polyphenols: All the phenolic compounds present in each extract was measured [13]. The method used was based on the reduction of reactive phospho-tungstic-molybdo or Folin-Ciocalteu (FCR) by polyphenols present in solution.
Method: Each sample to be tested is dissolved in a methanol-water (90:10, v/v) so as to obtain a concentration of 10 mg/mL. Then, this stock solution is diluted to 1/10th (1 mg/mL) with distilled water. A volume of 125 µL of diluted solution was mixed with 625 µL of Folin-Ciocalteu reagent (0.2 N), then incubated for 5 minutes. Then, 100 µL of an aqueous solution of sodium hydrogencarbonate (HCO3Na) at 75 g/L are added and then mixed by vortexing. The mixture was incubated for 2 hours. After incubation, the absorbance was measured at 760 nm using a spectrophotometer. Three tests are carried out for each extract. The reading was made against a blank consisting of a mixture of 0.5 mL of FCR and 1 mL of HCO3Na. The total polyphenol contents are determined using a straight calibration of gallic acid (0-200 mg/L by the equation Y=0.005*X+0.0885; R2=1) (Figure 1). The result, in mg/Gallic Acid Equivalent in 100 mg of extract (GAE mg/100 mg extract) is determined by the following formula:
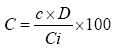
C: total polyphenol concentration of sample expressed in GAE mg/100 mg of extract.
c: read concentration of the sample
D: dilution factor
Ci: initial concentration of the stock solution in mg/mL.

Figure 1: Standard curve of gallic acid (760 nm) for the total polyphenols.
The levels of total flavonoids in the extracts were measured by the colorimetric method [14].
Method: A volume of 75 µL of 2% AlCl3 in pure methanol is mixed with an equal volume of extract to 1 mg/mL in methanol. Optical densities were read after 10 minutes at 415 nm using the spectrophotometer. Quercetin (0-100 mg/L) was used as the standard for the development of the calibration curve (Y=0.0251+0.0885*X; R2=0.99) (Figure 2). A mixture of 75 µL of extract and 75 µL of methanol without AlCl3 was used as white. A total of three (3) analyzes are performed for each sample and the given result was an average of three readings. The results are expressed in milligrams Quercetin equivalent of 100 mg of dry extract (mg QE/100 mg).
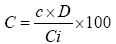
C=Quercetin Equivalent Value in mg in 100 mg
c=Read concentration of the sample (Q E mg/L) on the standard curve
D=Dilution factor of sample under measurement
Ci=Initial concentration of the sample solution to be measured

Figure 2: Standard curve of quercetin (415 nm) for total flavonoids.
Determination of ash
Total ash: This is the amount of non-volatile residual substance obtained after complete calcination of the drug.
Procedure: 3 g of powder of each drug for analysis was put into 3 previously marked crucibles and placed in the oven at 600°C for 24 hours. The crucibles were reweighed after cooling. The results were given by the following formula:
C=Total ash
PE=Mass of the test sample
MC=Mass of ash=Mass after oven-mass before the oven.
Ash insoluble in hydrochloric acid
Principle: the measurement of ash insoluble in hydrochloric acid (CC) quantifies the external compound (dirt, sand) or own plants (calcium concretion) contained in the drug.
Procedure: The 10% hydrochloric acid (20 mL) was placed on the total ash obtained. This mixture was heated in a water bath for 15 minutes. The insoluble residue in water after filtration was washed. The filter paper containing the residue was transferred into a caliberated crucible and placed in a furnace at 800°C for 3 hours. After cooling the crucible was weighed again. The following formula was used to calculate the percentage of hydrochloric ashes.
CC=Ash insoluble in hydrochloric acid
C=Total ash obtained
PE=Mass of the test sample
Sulphuric ashs
Principle: It quantifies the inorganic substances contained in drugs.
Procedure: In a marked crucible, 3 g of drug powder were soaked with concentrated sulfuric acid diluted to one half with water. The crucible was placed in an oven at 800 °C for 6 hours. After cooling in a desiccator, the whole was weighed. The following formula was used to calculate the percentage of sulfuric ash.
CS=Sulphuric ash
PE=Mass of the test sample
MC=mass sulfuric ash=mass of the drug moistened with concentrated sulfuric acid diluted to one half with water before oven-mass after oven.
Measurement of mineral salts
The qualitative and quantitative analysis of minerals are made using punctual microanalysis by energy dispersive spectrometry coupled with Scanning Electron Microscope/Energy Dispersion Spectrometry (SEM/EDS), variable pressure DC/AR (SEM FEG Zeiss Supra 40 VP). This device is equipped with an X-ray detector (Oxford Instruments) connected to a micro analyzer platform EDS (Inca Cool Dry, without liquid nitrogen).
Procedure: Two grams of sample was incinerated (ASTM D 482), then cooled in a dryer. Then 10 mg of ash are homogeneously spread with double-sided adhesive carbon onto a primed pad and attached to the object holder of SEM/EDS. The whole was introduced into the SEM chamber for microanalysis-RX (EDS). The desired minerals are primarily calcium, chromium, magnesium, manganese, sodium, potassium and zinc.
Results are proportions, averages of three trials.
Laboratory animals used were mice. These mice had characteristics of vigor and productivity called CF1 (Carworth Farms Strain 1) male and female, aged 8 to 10 weeks. The international ethical standards on the use of laboratory animals were observed [15].
Principle: The acute toxic studies have been carried out [15] in accordance with OECD guidelines - 423. sought acute signs are apathy, excitement, breathing disorders, grooming excessive, denial of food and/or drink, oral bleeding and/or nasal, abdominal pain (writhing), diarrhea, tremor, convulsions, coma and/or death.
This method allows the estimation of toxicity, and the results used to classify a substance for acute toxicity, according to the Globally Harmonized System of Classification and Labeling of Chemicals.
A maximum single dose is administered to a batch of 3 mice for each extract. Two cases are possible: If there's death, the second group receives a lower dose. If they are living the second group receives a higher dose. The animals are observed with special attention during the first 4 hours then daily, then a total of 14 days.
Procedure: For each drug, three mice (n=3) of both sexes, randomly selected, were used. Animals were fasted for 4 h, only, free access to water. The test extract was administered by gavage to the maximum dose of 3000 mg/Kg. The mortality and signs of toxicity were sought for 3 days (or 14 days time limit for seeking acute toxicity) and noted. The mortality observed in 2/3 or 3/3 animals, leads to consider the dose administered as a toxic dose. If mortality is observed in one out of three mice animals, the same dose is administered again for another batch to confirm the toxic effect. If no mortality is observed, the procedure is then repeated with extracts of doses higher plants.
Major chemical constituents
The phytochemical screening of the herbal drug showed the presence of all major chemical groups. The present study sought more secondary metabolites; minerals salt contained in Ocimum gratissimum leaves that may explain the anti-hyperglycemic activity of this medicinal plant. It also assessed the toxicity of the aqueous infused.
Regarding the composition secondary metabolites of the drug collected in Ivory Coast, West Africa, phytochemical screening showed the main chemical constituents, total alkaloids, saponins, polyphenols, tannins and flavonoids and terpenes sterols and the presence of mucilage except quinone substances (Table 1). These results confirm those found by N'Guessan [16]. Also the presence of mucilage reported in Abelmoschus esculentus Moench (Malvaceae) by a study by Masashi [17], showed a glucose lowering activity in mice.
|
Ext |
Stérol-Terpène |
Poly-phénols |
Flav |
Tanins |
Quinones |
Alc. |
Sap |
Form Index (%) |
Muc |
|
|---|---|---|---|---|---|---|---|---|---|---|
|
G |
C |
|||||||||
|
Infused |
+ |
+ |
+ |
- |
+ |
– |
+ |
+ |
12.5 |
++ |
Table 1: Phytochemical screening of infused Ocimum gratissimum L.
The intensity of coloration during when phytochemical screening and the importance of total polyphenols and total flavonoids in particular led to measuring them.
Determination of total polyphenols and total flavonoids
The total polyphenol content in the aqueous totum is 11.98 ± 0.07 mg GAE/g dry matter, while the total flavonoid content is 3.99 ± 0.57 mg QE/g dry matter.
These values are close to those found in Euphorbia hirta L. respectively GAE 12.1 mg/g and 4.14 mg QE/g [11]. These compounds could participate in the anti diabetic activity of the drug; diabetes is part of metabolic diseases and favorably influenced by the polyphenolic compound [18].
In the presence of these secondary metabolites in the plant, are also found other compounds that are among other minerals. Minerals are essential elements involved in many mechanisms. They are supplied by food or medication.
Seeking explanation for the anti-hyperglycemic activity of the plant has led to our search for micronutrients such as trace elements, involved in glucose metabolism [19]. This research has uncovered many minerals (Tables 2 and 3) including magnesium, an enzyme activator which is involved in major metabolic pathways in the body and increases the secretion of insulin [20]; potassium, major ion of positive charge in the cells of the organism participates in inter alia the manufacture of glycogen and secretion of hormones including insulin [21]; calcium, an intracellular second messenger in insulin hormone response [22], copper, an essential antioxidant in the body and nutrient coenzyme zinc, are supporting a good insulin activity, [19], without forgetting the Manganese [23].
| Spectrum | In stats. | Na | Mg | Si | P | S | Cl | K | Ca | Fe | Cu | Zn | At | O | Total |
|---|---|---|---|---|---|---|---|---|---|---|---|---|---|---|---|
| Spectrum 1 | Yes | 0.25 | 4.13 | 0.40 | 4.75 | 0.56 | 9.34 | 29.55 | 23.53 | 0.16 | 0.53 | 0.20 | 0.72 | 25.89 | 100.00 |
| Spectrum 2 | Yes | 0.27 | 4.27 | 0.52 | 4.66 | 0.42 | 9.41 | 29.11 | 24.13 | 0.13 | 0.35 | 0.03 | 0.86 | 25.85 | 100.00 |
| Spectrum 3 | Yes | 0.29 | 4.23 | 0.49 | 4.90 | 0.56 | 9.73 | 27.82 | 24.31 | 0.08 | 0.37 | 0.17 | 0.89 | 26.16 | 100.00 |
| Mean | 0.27 | 4.21 | 0.47 | 4.77 | 0.51 | 9.49 | 28.83 | 23.99 | 0.12 | 0.42 | 0.13 | 0.82 | 25.97 | 100 | |
| Std. deviation | 0.02 | 0.07 | 0.06 | 0.12 | 0.08 | 0.21 | 0.9 | 0.41 | 0.04 | 0.1 | 0.09 | 0.09 | 0.17 | ||
| Max. | 0.29 | 4.27 | 0.52 | 4.9 | 0.56 | 9.73 | 29.55 | 24.31 | 0.16 | 0.53 | 0.2 | 0.89 | 26.16 | ||
| Min. | 0.25 | 4.13 | 0.4 | 4.66 | 0.42 | 9.34 | 27.82 | 23.53 | 0.08 | 0.35 | 0.03 | 0.72 | 25.85 |
Table 2: Mineral salt composition in percentage of weight in the drug (leaves) of Ocimum gratissimum L.
| Spectrum | In stats. | Na | Mg | Si | P | S | Cl | K | Ca | Fe | Cu | Zn | At | Total |
|---|---|---|---|---|---|---|---|---|---|---|---|---|---|---|
| Spectrum 1 | Yes | 0.34 | 6.84 | 0.85 | 10.87 | 1.41 | 0 | 35.59 | 32.92 | 0.21 | 0.67 | 0.24 | 0 | 89.94 |
| Spectrum 2 | Yes | 0.36 | 7.07 | 1.11 | 10.67 | 1.05 | 0 | 35.07 | 33.76 | 0.17 | 0.44 | 0.04 | 0 | 89.73 |
| Spectrum 3 | Yes | 0.39 | 7.01 | 1.05 | 11.23 | 1.4 | 0 | 33.51 | 34.01 | 0.1 | 0.47 | 0.21 | 0 | 89.38 |
| Mean | 0.36 | 6.98 | 1.00 | 10.92 | 1.29 | 0.00 | 34.72 | 33.56 | 0.16 | 0.52 | 0.17 | 0.00 | 89.68 | |
| Std. deviation | 0.02 | 0.12 | 0.14 | 0.28 | 0.21 | 0.00 | 1.08 | 0.57 | 0.06 | 0.12 | 0.11 | 0.00 | ||
| Max. | 0.39 | 7.07 | 1.11 | 11.23 | 1.41 | 0.00 | 35.59 | 34.01 | 0.21 | 0.67 | 0.24 | 0.00 | ||
| Min. | 0.34 | 6.84 | 0.85 | 10.67 | 1.05 | 0.00 | 33.51 | 32.92 | 0.10 | 0.44 | 0.04 | 0.00 |
Table 3: Proportion (%) of mineral salt in the drug (leaves) of Ocimum gratissimum L.
Given the properties that Ocimum gratissimum present, and for its secondary metabolites compositions, for its various pharmacological properties, especially against the installation of diabetes [11], a phytochemical analysis was also conducted.
Vegetables are rich in water. The proportion of this water ranges from 60% to 80% depending on the organ of the plant. Drugs are well preserved when the content of the water is less than or equal to 10% [12]. In this study, the powder of dried leaves of Ocimum gratissimum L. have a moisture content of 8.97% less than 10%.
The value of ash gives an idea of the inorganic composition or other impurities in the drug [24]. The value of Ocimum gratissimum L. total ash is 8.45% close to those of Bihari [25] who found 8.7% while the sulfuric acid ash differ 10.27% vs 3.7% [25]. This could be because of the nature of soil on which the plant was grown.
On toxicity, Ocimum gratissimum is not toxic to 3000 mg/kg bw for rats. These results are consistent with data reported by some authors, it is good to note that this drug is consumed as food or spice in Nigeria, Togo and Côte d'Ivoire [8,10].
Searching for the various compositions of Ocimum gratissimum has helped to better understand the normal glycemic activity of this plant. Indeed the simultaneous presence of mucilage, secondary metabolites and minerals salts exerts a synergistic action to reduce hyperglycemia and undertakes remedial action due to the presence of polyphenolic compounds including flavonoids. It is also desirable to encourage people in developing countries to consume more the leaves of Ocimum gratissimum in view of the galloping installation of diabetes mellitus in our communities.
