Research Article - (2018) Volume 6, Issue 5
In this study, the determination of secondary metabolites, anti-oxidant and cytotoxic activity of seed coat of Macrotyloma uniflorum were carried out in different solvents (petroleum ether, chloroform, ethanol, and water), according to their increasing polarity. Alkaloid and tannin content was analyzed by simple titrimetric method. Colorimetric method was used for the determination of phenolic, flavonoid, terpenoid and saponin content. Antioxidant activity was determined by DPPH free radical scavenging assay and cytotoxic activity was evaluated by Trypan blue exclusion assay. The results indicated that sample seed coat extracted with ethanol (sample 3) contained high level of alkaloid (0.66 ± 0.01 mg/g), phenol (42.38 ± 0.53 mg/g), flavonoid (22.81 ± 0.48 mg/g), tannin (55.89 ± 0.75 mg/g), saponin (24.85 ± 0.53 mg/g), and terpenoid (54.60 ± 1.89 mg/g) and had anti-oxidant and cytotoxic activity against B16F10 and B16BL6 cell line. Further, the results of preliminary DPPH free radical scavenging assay suggested anti-oxidant and Trypan blue exclusion assay on B16F10 and B16BL6 cell line suggested that potent anticancer activity of sample 3 is accompanied.
Keywords: Macrotyloma uniflorum; Phytochemical; Anti-oxidant activity; Cytotoxic activity
The World Health Organization (WHO) estimates that in present 80 percent of the population of Asian and African countries use herbal medicine for the aspect of primary health care’s. Medicinal plants have been used as an exemplary source for centuries as an alternative remedy for treating human diseases because they contain numerous active phytochemicals having therapeutic value [1]. Macrotyloma uniflorum (Figure 1) is one of the lesser-known grain legume species belonging to family Fabaceae which is known as Kurti kalai in Bengali and horse gram in English [2]. It is a climbing herb with slam up to 60 cm. tall with a perennial fibrous rhizome stem annual densely covered with whitish hairs [3]. Macrotyloma uniflorum is mainly cultivated in South India, Sri Lanka, Malaysia, West Indies, and Central, East and Southern Africa [4].
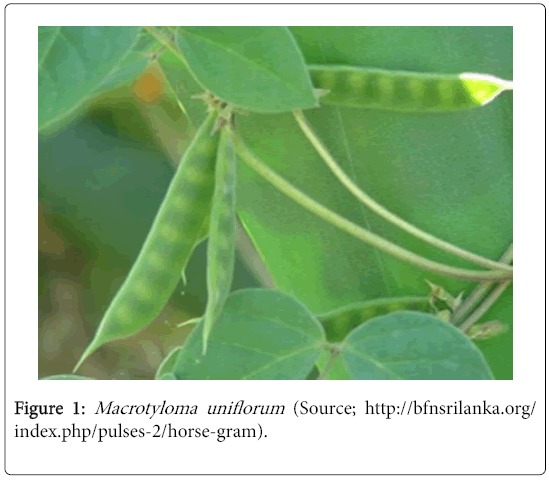
Figure 1: Macrotyloma uniflorum (Source; http://bfnsrilanka.org/index.php/pulses-2/horse-gram).
It is a minor legume used as a pulse crop in India having high nutritious as well as ethno-medicinal values. The seeds of Macrotyloma uniflorum contain much more bioactive substances such as alkaloid, phenolic acid, tannin, flavonoids, fiber, essential fatty acid etc., which have significant metabolic and physiological effects [5]. Grain legumes/ pulses play an important role in the traditional diets of many parts of the world. They are low in fat and excellent sources of protein, dietary fiber, a variety of micronutrients and macronutrient [6]. The most important pharmacological activities are astringent, anthelmintic, antipyretic, anti-oxidant activity, urinary discharges, and cardiovascular disease. According to traditional medicinal knowledge, the seed is also used for the treatment of uterine stones, asthma, bronchitis, hiccup, diseases of the brain and eyes, piles, inflammation, liver troubles etc., [7,8].
In the present study, we report the qualitative and quantitative estimation of some important phytochemical constituents of seed coat of Macrotyloma uniflorum in different solvents extract and were further evaluated for their anti-oxidant and anti-cancer activity.
Plant material collection
Fresh seed of the plant Macrotyloma uniflorum were collected from local grocery shop of Agartala Gulbazar market, West Tripura district, India. Seed were collected in the months of February 2016, and were identified by Prof. Badal Krishna Datta, Taxonomist the Department of Botany, Tripura Central University, Tripura, India.
Test cell line collection
Mouse melanoma B16F10 and B16BL6 cell line was collected from National Centre for Cell Science (NCCS), Pune, India.
Chemicals
Petroleum ether, chloroform, methanol, Picric acid, glacial acetic acid, sodium nitrite, ferric chloride, sulfuric acid, n-butanol, hydrochloric acid, sodium hydroxide, folin-ciocalteu reagent, sodium bicarbonate, aluminum chloride, potassium permanganate, DMSO, sodium chloride, potassium chloride, disodium hydrogen phosphate, anisaldehyde and quercetin were purchase from Sisco Research Laboratories Pvt. Ltd. (SRL) Mumbai, India. Ethanol was purchase from Changshu Yangyuan chemical, China. DPPH, methyl red indicator, typan blue, acridine orange, ethidium bromide, and indigo carmine were purchase from HiMedia laboratories Pvt. Ltd. Mumbai, India. Tannic acid, saponin, linalool, and cisplatine were purchase from Merck Millipore; USA and were used without further purification.
Processing of the plants materials
The seeds were properly washed in tap water and rinsed with distilled water. The rinsed seeds were air dried completely and the seed coat was separated one by one. The separated seeds coat (800 gm) were transfer into a grinder to obtain a powdered, is passed through a sieve (mesh no. 40) in order to obtain uniform size of fine powdered material and were used for further analysis.
Preparation of plant extract
20 g of fine powdered plant material was weighed and packed into a Soxhlet apparatus and extracted with 300 ml of petroleum ether (sample 1) and other three different kinds of polar solvent according to their increasing polarity (chloroform>ethanol>Water) (Table 1) at 60-65°C for 4 h. The extract was filtered through Whatman filter paper No. 1 and the filtrate was concentrated under reduced pressure at 40°C. The samples extract was dried and stored at 4°C in storage vials for further experimental studies. Percentage of yield was determined by following equation.
| Name of the samples |
Solvents used for extraction | Nature of the solvents (in order of increasing polarity) |
% of yield |
|---|---|---|---|
| Sample 1 | Petroleum ether | Most volatile liquid | 0.64 |
| Sample 2 | Chloroform | Polar solvent polarity is 0.259 | 2.82 |
| Sample 3 | Ethanol | Polar solvent polarity is 0.654 | 14.21 |
| Sample 4 | Water | Polar solvent polarity is 1.00 | 10.30 |
Table 1: Name of the sample, solvent used for extraction, nature of the solvent and percentage (%) of yield for various samples of Macrotyloma uniflorum .
Similarly, for samples 2, 3, and 4 were extracted using different solvents and subjected to further phytochemical analysis.
Qualitative analysis of plant secondary metabolites
Different solvent extracts (stored at 4°C) were dissolved in 2 ml of same solvent which was used for extraction and carried out for the qualitative test analysis for the presence of alkaloid, phenol, flavonoid, tannin, terpenoid, and steroid.
Test for alkaloid
Hager's test: 2 ml of test solution was treated with few drops of Hager's reagent (saturated picric acid solution); formation of yellow precipitate indicated the presence of alkaloid [9].
Test for phenol
Ellagic acid test: 2 ml of test solution was treated with few drops of 5% (w/v) glacial acetic acid and 5% (w/v) NaNO2 solution. The solution turned muddy or niger brown precipitate indicated the presence of Phenol [10].
Test for flavonoid
Ferric chloride test: 2 ml of test solution was treated with few drops of ferric chloride solution; formation of blackish red color indicated the presence of flavonoid [11].
Test for tannin
Ferric chloride test: 2 mL of the test solution was treated with few drops of 10% Ferric chloride solution. The occurrence of blackish blue color showed the presence of gallic tannins and a green-blackish color indicated presence of catechol tannin [12].
Test for saponin
Frothing test: 2 ml of test solution was treated with 2 ml of distilled water in a test tube and shake. Formation of frothing indicated the presence of saponin [13].
Test for terpenoid
Salkowski test: 2 ml of each extract is treated with 2 ml of chloroform, and concentrated H2SO4 (3 ml), formation of brown coloration at the inter face showed the presence of terpenoid [14].
Qualitative determination of plant secondary metabolites
Determination of total alkaloid: Alkaloid content was determined by titrimetric method. In a 100 ml beaker, 20 ml of n-butanol was taken and 20 mg of plant extract was added to it and vigorously stirred to become a clear solution. 10 ml of this solution was taken into a 100 ml separating funnel and 10 ml of 0.1 (N) HCl was added and shaken thoroughly for 2-3 minutes. The lower layer contained alkaloids neutralized with 0.1 (N) HCl and the upper layer contained n-butanol. 10 ml of HCl portion was collected into a beaker and 2-3 drops of methyl red was added to it, which turned the solution into slightly reddish color. The contents of beaker were titrated against 0.1 (N) NaOH, till color changes from red to pale yellow. The neutralization point was determined. Same procedure was repeated triplicate for sample 1, sample 2, sample 3, and sample 4 [15].
The total amount of alkaloids was calculated by considering the following equivalent:
1 ml 0.1 N HCl 0.01629 g alkaloid
Determination of phenolic content: The total phenolic content present in the different solvents plant extract (sample 1, sample 2, sample 3 and sample 4) were determined by using Folin-Ciocalteu colorimetric method based of oxidation-reduction reaction. A stock solution of 1 mg/ml tannic acid was prepared in ethanol. It was then diluted ten times and used as working standard solution. From this stock, 0.1, 0.2, 0.3, 0.4, 0.5 ml of sample were taken into separate test tubes. Then 0.5 ml of Folin-Ciocalteu reagent and 1 ml of saturated sodium bicarbonate solution was added to each of the test tube. The volume of each test tube was made up to 5 ml with distilled water. Then the content of all the test tubes were incubated into a boiling water bath for 2 minutes exactly. The test tubes were cooled at room temperature and the absorbance of each content of the test tube was measured at 560 nm into a UV-VIS Spectrophotometer (Shimadzu UV-1800) against the reagent blank. The total phenol content was calculated from calibration curve [16].
For samples 200 μl of extract (sample 1, sample 2, sample 3, and sample 4) were repeated in triplicate form and the color was generated as usual. The total phenolic content was calculated from calibration curve.
Determination of total flavonoid content: The total lavonoid content present in the different solvents plant extract (sample 1, sample 2, sample 3 and sample 4) was determined by using aluminum chloride colorimetric method. A working standard solution of 1 mg/ml quercetin was prepared in ethanol. From this stock, 0.1, 0.2, 0.3, 0.4, 0.5 ml of sample were taken into separate test tubes and volume was made up to 1 ml with ethanol. Then 4 ml of distilled water was added and incubated for 5 minutes. After 5 minutes 0.3 ml of 10%, aluminum chloride solution was added and allow to stands for 6 minutes. Then added 2 ml of 1 mol/lit NaOH solution and finally volume was made 10 ml and absorbance was taken at 517 nm [17].
For samples 200 μl of extract (sample 1, sample 2, sample 3, and sample 4) were repeated in triplicate format and the color was generated as usual. The total flavonoid content was calculated from calibration curve.
Determination of tannin content: The total tannin content present in the different solvents plant extract (sample 1, sample 2, sample 3 and sample 4) was determined by titrimetric method. 25 ml of the infusion was measured into 1 L conical flask, and then 25 ml of indigo solution and 750 ml distilled water was added. 0.1 N aqueous solution of KMnO4 was used for titration untilled the blue color solution changed to green color and noted the scale mark of burette. Then few drops were added at time until solution became golden yellow color. The blank tests by titration of a mixture of 25 ml indigo carmine and 750 ml of distilled water was carried out. All samples were analyzed in triplicate. The following equation was used for determination of tannin content [18].

Where, V=0.1 N aqueous solution of KMnO4 for the titration of the sample, ml.
V0=0.1 N aqueous solution of KMnO4 for the titration of blank sample, ml.
0.004157=Tannin equivalent in 1 ml of 0.1 N aqueous solution of KMnO4.
g=Mass of the sample taken for analysis.
250=volume of the volumetric flax, ml.
100=Percent (%).
Determination of saponin content: The total saponin content present in the different solvents plant extract (sample 1, sample 2, sample 3 and sample 4) was determined by using anisaldehyde reagent by colorimetric method. A working standard solution of 1 mg/ml saponin was prepared in water. From this stock, 0.1, 0.2, 0.3, 0.4, 0.5 ml of sample were taken into separate test tubes and 0.5% anisaldehyde reagent were added and kept aside for 10 min. Later, 2 ml of 50% sulphuric acid was added and test tubes were shaken and kept in water bath with constant temperature of 60°C-65°C. After 10 min, test tubes were allowed to cool down at room temperature and absorbance was taken at 435 nm [19].
For samples, 200 μl of extract (sample 1, sample 2, sample 3, and sample 4) were repeated in triplicate format and rest of the procedure was same as standard. The saponin content was calculated from calibration curve.
Determination of terpenoid content: A working standard solution of 1 mg/ml linalool was prepared in 95% methanol. From this stock, 0.1, 0.2, 0.3, 0.4, 0.5 ml of sample were taken into separate test tubes, 1.5 ml of chloroform was added, and volume was made up to 2 ml with 95% methanol [20]. For samples 200 μl of extract (sample 1, sample 2, sample 3, and sample 4) were repeated in triplicate format and rest of the procedure as same as standard. The terpenoid content was calculated from calibration curve.
Anti-oxidant activity
The antioxidant activity of the extracts was determined by the 1,1- diphenyl-2-picryl-hydrazyl (DPPH) assay, as described earlier with some modi ications of Mensor et al. method. A working standard solution of 1 mg/ml ascorbic acid was prepared in methanol. From this stock, 10, 20, 40, 80, and 100 μl of sample were taken into separate test tubes and 3.8 ml of 0.1 mM methanolic DPPH solution was added in every test tubes and reaction was incubated for 30 minutes at room temperature in dark room. After 30 minutes absorbance was taken at 517 nm and percentage inhibition was calculated in following equation [21].
For samples (sample 1, sample 2, sample 3, and sample 4) were followed.
Cytotoxic activity
Trypan blue exclusion assay was performed for cytotoxicity activity for sample 1, sample 2, sample 3, and sample 4 against mouse melanoma B16F10 and B16BL6 cell line. Briefly, the cells were plated at a density of 5 × 10⁶ in 12-well flat-bottomed tissue culture (TC) plates and treated with sample 1, Samples 2, sample 3, and sample 4 respectively at the concentrations of 100 μg/well and 500 μg/well. Cisplatin was treated as positive control and DMSO treated as negative control. After that the cells were harvested, washed twice with PBS and stained with 0.4% trypan blue. Approximately 100 cells were counted with a hemocytometer for each experiment. The percentage of cytotoxicity was calculated by following equation [22].
% of cytotoxicity=(trypan blue positive cells/total cells counted) × 100
To detect nuclear damage or chromatin condensation, treated and untreated cells were washed twice with PBS. The conventional acridine orange staining procedure was followed to differentiate the live, apoptotic and necrotic cells and analyzed under fluorescence microscope with LASER beam excitation at 488 nm and 550 nm [23].
Statistical analysis
Statistical analysis was conducted using the statistical software package SPSS. The mean and standard deviation of the mean (SD) values of secondary metabolites was calculated.
Qualitative analysis of plant secondary metabolites
Preliminary screening of active component is most important in pharmaceutical industry because screening is a first way for development of new pharmaceutical products like antibiotic, vaccine, sera etc. [24]. In the present study, preliminary screening of extract of Macrotyloma uniflorum seed coat (Table 2) using four different solvents were carried out for the presence of alkaloid, phenol, flavonoid, tannin, saponin, and terpenoid. It was found that the presence of alkaloid in sample 2, sample 3, and sample 4 was in low concentration (+) and sample 3, sample 4 contained high concentration (+++) of phenol, while sample 2 contained moderate concentration (++) of phenol and low concentration (+) of flavonoid. Sample 3 and sample 4 contained a moderate concentration (++) of flavonoid, and high concentration (+++) of tannin while sample 2 contained moderate concentration (++) of tannin. In sample 2, sample 3, and sample 4 saponin content was found to be in moderate concentrations (++). Terpinoid was found to be present at moderate concentration (++) at sample 2, sample 3, and sample 4 but in sample 1 it was at low concentration (+).
| Secondary Metabolites | Sample 1 | Sample 2 | Sample 3 | Sample 4 |
|---|---|---|---|---|
| Alkaloid | - | + | + | + |
| Phenol | - | ++ | +++ | +++ |
| Flavonoid | - | + | ++ | ++ |
| Tannin | - | ++ | +++ | +++ |
| Saponin | - | ++ | ++ | ++ |
| Terpenoid | + | ++ | ++ | ++ |
| ** ‘-’ stand for absence; ‘++’ moderate concentration; ‘+++’ high concentration. | ||||
Table 2: Preliminary phytochemical analysis for different samples of Macrotyloma uniflorum .
Increase the polarity of the solvent greater the quantity of phytochemicals [25]. Alkaloid, phenol, lavanoid, saponin, phytosterols, glycoside were present in the seed of Macrotyloma uniflorum but their quantity varied for selection of the extracted solvent [26]. Samples extracted with methanol and water gave better response in phytochemical screening (Table 2).
Quantitative analysis of plant secondary metabolites
Estimation of phytochemical constituents of samples (Table 3) in different solvents showed that the samples extracted using highly polar solvent contained a good amount of plant secondary metabolites. Total phenolic, flavonoid, tarpenoid, and saponin contents of the seed coat extracts was calculated from the calibration curve (R2=0.997 for phenol, R2=0.99 for flavonoid, R2=0.98 for terpenoid and R2=0.99 for saponin). The range of total phenolic content varied from 19.21 ± 1.00 mg/g tannic acid equivalent to 42.38 ± 0.53 mg/g tannic acid equivalent. The range of total flavonoid content varied from 7.88 ± 0.29 mg/g quercetin equivalent to 22.81 ± 0.48 mg/g quercetin equivalent. The range of total saponin content was found to be varying from 16.82 ± 0.83 mg/g saponin equivalent to 24.85 ± 0.53 mg/g saponin equivalent. The range of Total terpenoid content was found to vary from 13.43 ± 0.61 mg/g linalool equivalent to 54.60 ± 1.89 mg/g linalool equivalent. Total tannin and total alkaloid content was determined by titrimetric method and compared with tannin equivalent factor to 0.1 (N) aqueous KMnO4 solutions as a titrant, and alkaloid equivalent factor to 0.1 (N) HCl as a titrant. The range of total tannin content was found to vary from 28.20 ± 0.63 mg/g to 55.89 ± 0.75 mg/g of dry extract. The range of total alkaloid content was found to vary from 0.55 ± 0.03 mg/g to 0.66 ± 0.01 mg/g of dry extract.
| Secondary Metabolites | Sample 1 (Mean ± SDs) |
Sample 2 (Mean ± SDs) |
Sample 3 (Mean ± SDs) |
Sample 4 (Mean ± SDs) |
|---|---|---|---|---|
| Total alkaloid mg/g | - | 0.55 ± 0.03 | 0.66 ± 0.01 | 0.59 ± 0.01 |
| Total phenol (mg/g) | - | 19.21 ± 1.00 | 42.38 ± 0.53 | 34.90 ± 0.21 |
| Total flavanoid (mg/g) | - | 7.88 ± 0.29 | 22.81 ± 0.48 | 12.90 ± 0.15 |
| Tannins (mg/g) | - | 28.20 ± 0.63 | 55.89 ± 0.75 | 47.54 ± 0.67 |
| Saponin (mg/g) | - | 16.82 ± 0.83 | 24.85 ± 0.53 | 19.74 ± 0.59 |
| Terpenoid (mg/g) | 13.43 ± 0.61 | 24.89 ± 0.54 | 54.60 ± 1.89 | 47.75 ± 0.64 |
Table 3: Quantitative estimation of total alkaloids, phenols, flavonoids, tannins, saponins, and terpenoids of various solvent extracts of Macrotyloma uniflorum .
Senguttuvan et al. determined total alkaloid, phenolic, flavonoid, tannin, and saponin for leaf and root extract of medicinal herb, Hypochaeris radicata for different solvent (petroleum ether, chloroform, ethyl acetate, methanol, and water) techniques. It was found that methanol extracted sample contained high percentage of yield and high level of phytochemicals. They concluded that it may be due to high polarity of methanolic solvent which can draw high variety of plant constituents than the other solvents did [27].
Antioxidant activity
Currently used synthetic antioxidants have been suspected to cause or promote negative health effects, hence stronger restrictions have been placed on their application and there is a trend to substitute them with naturally occurring antioxidants [28]. Pulses (beans, peas, and lentils) have been consumed for at least 10, 000 years and are among the most extensively used foods in the world [29]. Pulses contained phenols, flavonoids and bioflavonoids, all of which can act as antioxidants [30].
DPPH is a substance used for the evaluation of antioxidant activity [31]. In this experiment ascorbic acid was used as standard (Table 4). Among these four samples, sample 3 was shown the highest DPPH radical scavenging activity. LD50 value of sample 3 was 62.99 μg/ml. This might be due to the presence of higher amount of phenolic, flavonoid and tannin content.
| Name of the spl. | % scavenging at 10 μg/ml | % scavenging at 20 μg/ml | % scavenging at 40 μg/ml | % scavenging at 80 μg/ml | % scavenging at 100 μg/ml | LD50 µg/ml |
|---|---|---|---|---|---|---|
| Ascorbic acid | 63.07 | 63.24 | 63.84 | 63.92 | 64.61 | 57.73 |
| Spl 1 | 12.22 | 15.01 | 19.00 | 24.16 | 26.01 | 161.81 |
| Spl 2 | 30.25 | 35.08 | 42.33 | 58.31 | 61.03 | 68.70 |
| Spl 3 | 53.06 | 55.00 | 58.00 | 59.04 | 60.09 | 62.99 |
| Spl 4 | 40.12 | 48.02 | 53.17 | 61.21 | 63.22 | 65.35 |
Table 4: DPPH radical scavenging activity at different concentration and LD50 (μg/ml) of various sample of Macrotyloma uniflorum .
Cytotoxic activity
Approximately 60% of drugs currently used for cancer treatment had been isolated from natural products and the plant kingdom has been the most significant sources. These include vinca alkaloids, taxus diterpenes, camptotheca alkaloids, and podophyllum lignans. Currently 16 new plant-derived compounds being tested in clinical trials. 13 among them were in phase I or II and three are in phase III. Among these compounds, flavopiridol, isolated from the Indian tree Dysoxylum binectariferum and meisoindigo , isolated from the Chinese plant Indigofera tinctoria, had been shown to exhibit anticancer effects with lesser toxicity than conventional drugs [32].
Anti-cancer activity studies for sample 1, sample 2, sample 3, and sample 4 was carried out and compared it with standard drug cisplatin, 500 μg/106 and DMSO used as a control solvent. In our study we were applied skin cancer cell line B16F10 and B16BL6. Sample 1 showed no cytotoxic activity. Sample 3 showed a significant cytotoxic activity in B16F10 and, B16BL6 cell lines. The percentage of cytotoxic activity of sample 3 at 500 μg/106 and 100 μg/106 cells was found to be 41.00% and 64.00% respectively, whereas for Cisplatin 500 μg/106 was 32.01%. Sample 2 and sample 4 also shown effective cytotoxic activities (Table 5). When treated or untreated cells were stained with acridine orange and analyzed under fluorescence microscope with LASER beam excitation at 488 nm and 550 nm, it was shown that sample 1 had no cytotoxic activity. Sample 3 carried best cytotoxic effect and sample 2 and 4 effectively cytotoxic activity (Figure 2).
| Compound | Cell type | Control | 100 µg/106 Cells | 500 µg/106 Cells | Cisplatin 500 µg/106 |
|---|---|---|---|---|---|
| Spl 1 | B16F10 | 96.07% | - | - | - |
| B16BL6 | 96.00% | - | - | - | |
| Spl 2 | B16F10 | 96.00% | 74.50% | 48.00% | 32.01% |
| B16BL6 | 95.72% | 69.00% | 46.34% | 33.04% | |
| Spl 3 | B16F10 | 96.07% | 64.00% | 41.00% | 32.01% |
| B16BL6 | 95.54% | 61.50% | 39.80% | 32.01% | |
| Spl 4 | B16F10 | 96.00% | 63.70% | 46.00% | 33.03% |
| B16BL6 | 96.00% | 65.30% | 42.50% | 32.03% | |
| ** ‘-’ stand for no activity. | |||||
Table 5: Anti-cancer activity of mouse melanoma cell lines of various sample of Macrotyloma uniflorum .
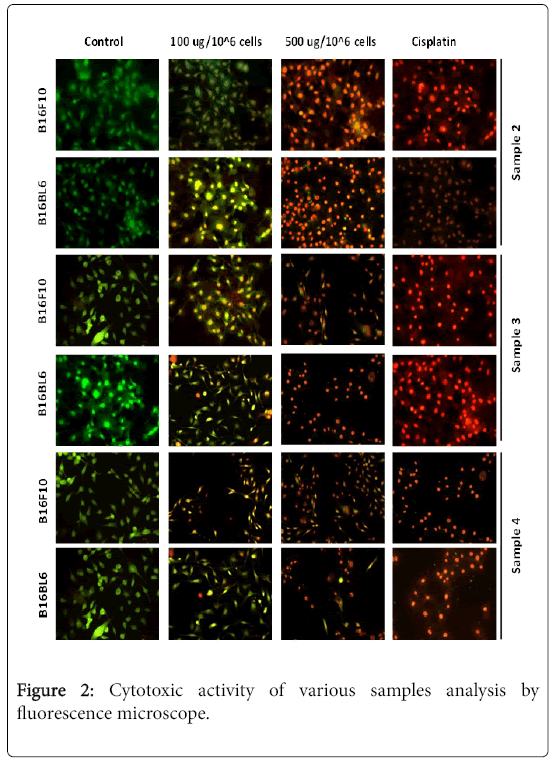
Figure 2: Cytotoxic activity of various samples analysis by fluorescence microscope.
Anticancer study of the seed of Macrotyloma uniflorum was done against human osteosarcoma cell line (MG 63) for ethanol or methanol extracted sample. At 200 μg/ml concentration methanol and ethanol extract had shown 82% and 74% cell viability. So, it was confirm that seed of Macrotyloma uniflorum carried anti-cancer activity against human osteosarcoma cell line [33]. In the present study, it was prove that seed coat of Macrotyloma uniflorum carring a significant anticancer activity against mouse melanoma B16F10 and B16BL6 cell line.
The optimal conditions for alkaloid, phenol, flavonoid, tannin, saponin, and terpinoid from four different samples were significantly different depending on the nature of polarity of the solvent. So, present study suggests that ethanolic and water extract of seed coat of Macrotyloma uniflorum is a potential source of antioxidant and anticancer activity against skin cancer. It could be used as a natural antioxidant, preservative, and medicinal agent in food and pharmaceutical industry. Further phtyochemical analysis is required to isolate the elements of the plant, which have a broad spectrum of pharmacological activity.
The authors are grateful to University Grant Commission (UGC), Govt. of India, for providing Startup Grant for newly recruited faculty and as financial support. We are also acknowledging Department of Science and Technology (DST), Govt. of India for awarding DST Fast Track Scheme to Dr. Kuntal Manna. The authors are also grateful for State Biotech Hub, Tripura Central University-799022, for providing working laboratory facility. The authors are also grateful for Central library, Tripura Central University-799022, for providing e-resources.
The authors declare no conflicts of interest.
