Research Article - (2018) Volume 6, Issue 1
Received Date: Nov 16, 2017 / Accepted Date: Nov 25, 2017 / Published Date: Nov 30, 2017
An unintended consequence of state-mandated cannabis testing regulations has been the resulting database from the analysis of thousands of individual cannabis flower samples from artificially restricted geographical regions. The resulting detailed chemical database can serve as the basis for the development of a chemotaxonomic classification scheme outside of conjectural cultivar naming by strain. Chemotaxonomic classification schemes for cannabis cultivars have previously been reported by others based largely on cannabis strains grown in California under an unregulated testing environment or in Europe from strains grown by a single cultivator. In this study 2,237 individual cannabis flower samples, representing 204 individual strains across 27 cultivators in a tightly regulated Nevada cannabis testing market, were analyzed across 11 cannabinoids and 19 terpenoids. Even though 98.3% of the samples were from Type I cannabis strains by cannabidiolic acid/tetrahydrocannabinolic acid (THCA) ratio of <0.5 CBDA, principal component analysis (PCA) of the combined dataset resulted in three distinct clusters that were distinguishable by terpene profiles alone. Further dissection of individual strains by cultivators within clusters revealed striking fidelity of terpenoid profiles and also revealed a few outliers. We propose that three terpenoid cluster assignments account for the diversity of drug type cannabis strains currently being grown in Nevada.
Keywords: Cannabis; Cannabis strains; Terpenes; Chemoprofile; Taxonomy
The lack of horticultural or agronomic naming conventions and registrations in the cannabis industry has created a confusing collection of strain names, making authenticity questionable for the cannabis consumer. Various efforts have been underway to make sense of cannabis strain names through the use of data analytics on broader cannabis flower chemoprofiles beyond strictly tetrahydrocannabinol (THC) and cannabidiol (CBD) potency even though harvesting a consistently reproducible cannabis crop is challenging under the best of agronomic standards. There are many environmental factors besides genetics that can impact the resulting chemical content of an agronomic plant. Reports indicate that cannabinoid and terpenoid content varies both intra-plant, inter-plant and between harvest lots [1-3]. Reducing consistently-grown cannabis to its extract is the best approach to achieving chemical profile uniformity [3].
Cannabis drug-type plants that have a cannabidiolic acid (CBDA)/tetrahydrocannabinolic acid (THCA) ratio of 3.0 are type III or hemp [4,5]. The obsession surrounding cannabinoids and in particular (-)trans-Δ9-tetrahydrocannabinol (-Δ9-THC) and cannabidiol (CBD) content in cannabis cultivars has overshadowed the importance of the terpenoid profile and content in specific cannabis cultivars. Today we know that terpenoids are contributing pharmacologically active compounds in cannabis and can be used to distinguish cannabis cultivars [6-8].
Of the roughly 140 identified terpenoids in cannabis, there seems to be consensus in the literature that between 17 to 19 are the most useful in defining a cannabis chemotype [9-11].
Terpenoid content in the cured flower can range from 0.5% to 3% [12]. Terpenoids demonstrate effects on the brain at very low ambient air levels in animal studies [13]. Generally speaking terpenoids contribute a sedative and anxiolytic effect to cannabis with more specific pharmacological effects attributed to individual terpenoids; such as, pinene exhibiting antibiotic activity [14] or β-caryophyllene providing gastric cytoprotective activity [15] or the anticonvulsive effects of β-myrcene [16].
Previous groups have made great strides in demonstrating that terpenoid content can be used to distinguish cannabis strains, varieties or cultivars based on the nomenclature in use [11,12,17]. These studies have also highlighted the importance of obtaining cannabis samples of sufficient size and representativeness to result in a valid test [18]. Notably, previous reports demonstrate the need for the use of validated analytical test methods as well as reproducibility of sample set data. In 2010, Fishedick et al. showed that across 11 cannabis varieties, all grown by one cultivator, each variety was distinguishable based on the occurrence of 36 different chemical compounds including 27 terpenoids using principle component analysis (PCA) [19,20].
A recent genomic analysis of diversity among 340 Cannabis sativa L. varieties demonstrated the existence of three major cannabis groups represented by BLDT, NLDT and hemp [21]. In an elegant time-course study over the growth cycle of specific chemotyped cannabis plants Aizpurua-Olaizola et al. [1] found differences in the evolution of monoterpene and sesquiterpene patterns within chemotypes. Here we report on the analysis of the chemoprofile data for 2,237 individual cannabis flower samples representing 204 individual cultivars across 27 cultivators in a tightly regulated Nevada cannabis testing market. Even though all of the samples except for 1.7% of the samples were type I based on CBDA/THCA ratio, the terpenoid chemoprofiles distinguished the samples into three separate clusters.
Chemicals and reagents
Cannabinoid certified reference standards for THCA, CBDA, Δ-9 THC, CBD, tetrahydrocannabinolic acid (THCV), cannabidivarin (CBDV), cannabigerol (CBG), cannabigerolic acid (CBGA), cannabichromene (CBC), Δ-8 THC, and cannabinol (CBN) were obtained from Cayman Chemical (Ann Arbor, MI) as 1.0 mg/mL solutions in methanol. Certified reference standards of the following terpenoids used in this study were obtained from Restek (Bellefonte, PA): caryophyllene-oxide, α-bisabolol, β-pinene, β-myrcene, α-pinene, γ-terpinene, α-terpinene, limonene, β-caryophyllene, α-humulene, trans-nerolidol, gerinol, camphene, guaiol, Δ-3-carene, p-cymene, eucalyptol, terpinolene, ocimene, p-cymene. All organic solvents used for extraction and HPLC analysis were HPLC analytical-grade and obtained from VWR.
Cannabis samples and sample preparation
Plant material used for analyses in this study was collected during Digipath Labs normal sample acquisition activities at 27 different licensed cannabis cultivators in either Clark County or Nye County, Nevada. Between 8 and 10 g of cured cannabis flower sample was randomly selected from 5-lb batches per State of Nevada mandate. The flower samples were routinely homogenized using a mortar and pestle with liquid nitrogen. Samples were processed for analysis within 24 h. Moisture content of a representative 0.5 g of homogenized plant material from each sample was analyzed using a Shimadzu moisture analyzer Model MOC63U. Subsequent cannabinoid and terpenoid analytes were measured as mass by percentage and not adjusted for moisture content.
HPLC-DAD for cannabinoid analysis
The internally validated cannabinoid assay was run on an Agilent Technologies 1260 UPLC system (Santa Clara CA) equipped with a G4212A DAD, G1316C temperature-controlled column compartment, G4226A autosampler, and G4204A quaternary pump. The separation of eleven cannabinoids was accomplished on a Poroshell 120 EC-C18 column (2.7 μm, 150 × 2.1 mm id) with a Poroshell 120 EC-C18 guard column (2.7 μm, 5 × 2.1 mm id). Open Lab CDS Chemstation Rev C. 01.06 (61) software (Agilent Technologies) was used to control the instrument, acquire data and integrate the peaks. Injection volume was 6 μL for all certified reference calibration standards, quality control standards, and individual sample analyses. Full spectra were recorded from 200 to 400 nm, and 228 nm was used for quantification of all analytes. Mobile phases consisted of 0.1% formic acid (VWR Part No. 0961-500 ML) in HPLC grade water (CAS 7732-18-5) on the A side and 0.1% formic acid in LCMS grade methanol (VWR Part No. MX0486-1) on the B side. The flow rate was 0.5 mL/min, and the assay began with a 1 min isocratic hold at 85% B, followed by a linear gradient to 95% B over 8 min; 95% B was maintained for 2 min, then the column was re-equilibrated at 85% B for 4 min before the next injection. The total run time for the method was 13 min.
Headspace GC-MS for terpenoid analysis
Terpenoid analyses for this study was carried out on an Agilent 7890B GC/7697A Headspace/5977A mass spectrophotometer equipped with a DB-624UI, 30 m × 0.25 mm ID × 1.40 μm (cat #122-1334UI) and Agilent 5181-8818 split/splitless liner. The injector port temperature was 250°C with a transfer line, valve oven and needle temperature of 180°C. Sample equilibration time was 10 min, vial pressure was set at 20 psi and loop pressure to 15 psi. The oven temperature 80°C (hold 0.10 min) to 120°C at 15°C/min (hold 3.0 min) to 250°C at 16°C/min (hold 3.5 min). The carrier gas was helium at a constant flow of 33.0 cm/sec (0.8 ml/min). The MS detector was set to scan with a range from 50-300 m/z. The instrument was controlled by Agilent Masshunter quantitative analysis (Vers. B.08.00 Build 8.0.593.0). All terpenoids were identified and quantified based on comparing to the retention times of certified reference standards from Restek (Bellefonte, PA) with Masshunter library confirmation.
Data and statistical analysis
Principle Component Analysis (PCA) was used as a statistical tool for exploratory data analysis to infer predictive models. PCA orthogonally transforms a dataset of possibly correlated variables into a set of values of linearly-uncorrelated variables called principal components [19,20]. Scaling was performed using the root-meansquare method which is defined by sqrt(sum(x^2)/(n-1)), where x is a vector of the non-missing values and n is the number of non missing values. Cluster estimation was performed using the Nb Clust function provided by the Nb Clust package for R [22]. Nb Clust utilizes 25 different cluster estimation indices to generate a majority rules number of clusters for the given variable set. Clustering was done using the k means hierarchical clustering method available in the R stats package. Principal component analyses (PCA) were conducted in R version 3.0.2 [23] and then visualized with the package ggplot2 [24].
R version 3.0.2 [23] was used to find mean terpenoid concentrations and variances. Individual cultivars ranging from 6 to 47 reps across cultivators were selected from each cluster for further terpenoid analysis. In rare cases, individual cultivar outliers appearing in two clusters were removed. A special case observed for Gorilla Glue #4, where 18 samples were in cluster #1 and 24 in cluster #3, was analyzed separately. Stacked bar plots of terpenoid concentrations were plotted using Microsoft Excel to graphically represent the descriptive statistics. Bar charts were used to display the individual terpenoid analyte profiles.
The data analyzed in this study came from cannabis flower samples cultivated in Nevada by licensed cultivators and as sampled by Digipath Labs over a period of one year per State of Nevada guidelines for medical marijuana testing in Las Vegas, NV. The study included 2,237 individual cured flower samples after removing all incomplete datasets and those cultivars represented by less than 3 replicates over time. The 2,237 samples represented 204 different cultivars from 27 different growers. Each flower sample’s dataset included 11 cannabinoids and 19 terpenoids see Table 1 for which certified reference standards are available and had previously been used to generate calibration curves using our laboratory’s validated standard operating procedures. The moisture content as determined for each sample ranged between 8 to 10%. Data were not adjusted for moisture content.
| Cannabinoids | Terpenoids |
|---|---|
| Cannabichromene (CBC) Cannabidiol (CBD) Cannabigerol (CBG) Cannabidivarin (CBDV) Cannabigerol (CBG) Cannabigerolic acid (CBGA) Cannabinol (CBN) D-8 tetrahydrocannabinol (Δ8THC) D-9 tetrahydrocannabinol (Δ9THC) Tetrahydrocannabinolic acid (THCA) Tetrahydrocannabivarin (THCV) |
a-Bisabolol a-Humulene a-Terpinene g-Terpinene b-Caryophyllene Limonene b-Myrcene b-Pinene a-Pinene Camphene Caryophyllene oxide Geraniol Isopulegol Eucalyptol Ocimene p-Cymene Terpinolene Δ-3-Carene |
Table 1: Profiled Chemicals.
PCA clustal analysis of the resulting terpenoid data for the 2,237 individual samples resolved into three terpenoid clusters (Figure 1) with the vast majority, 1,339 of the samples, falling into cluster #1 (red), followed by 743 samples in cluster #3 (blue) and the least populated cluster #2 (green) containing 155 samples. The PCA analysis did not differentiate by cultivar but by the individual terpenoid sample profiles. Inclusion of the cannabinoid data with the terpenoid data for PCA did not further resolve the outcome beyond the optimal three clusters (data not shown). However, there were 40 samples that fell outside of the consistent type I CBDA/THCA ratio of <0.5. Eight of those 40 samples were cannabinoid type III with a CBDA/THCA ratio of >3.0 and all clustered in terpenoid cluster #3. The other 32 samples fell into cannabinoid type II with 11 in terpenoid cluster #2 while the remaining 21 were in terpenoid cluster #1.
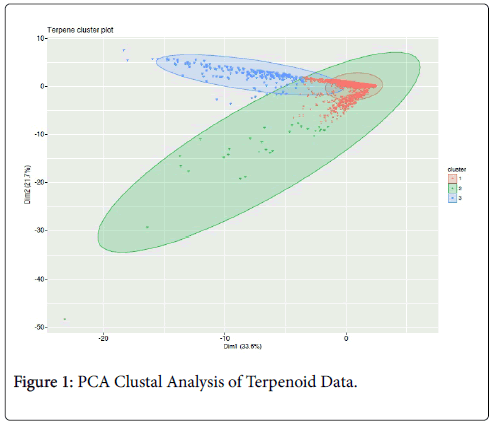
Figure 1: PCA Clustal Analysis of Terpenoid Data.
Bar plots of the mean with 99% confidence intervals for each of the 19 terpenoids across all 2,237 cultivar samples are shown in Figure 2. The combined terpenoid sample data illustrates the highest prevalence for β-myrcene, limonene, β-caryophyllene, α-pinene, α-humulene and β-pinene, similar to what others have previously reported [7,12,17].
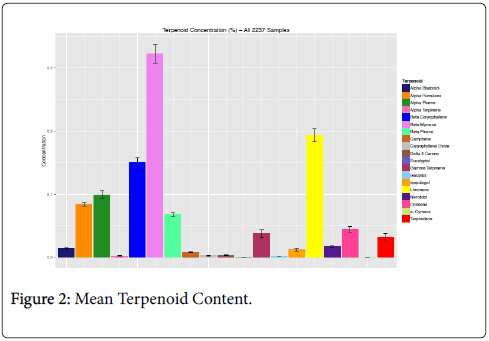
Figure 2: Mean Terpenoid Content.
Segregation of the same terpenoid data by cluster assignment revealed unique terpenoid chemoprofiles in comparison to the largely uniform non-discriminating cannabinoid data (Figure 3). Cannabis samples falling within terpenoid cluster #1 were dominated by β- myrcene, whereas terpenoid cluster #2 samples were higher in γ- terpinene and terpinolene and finally terpenoid cluster #3 sample data was dominated by limonene, β-myrcene and β-caryophyllene (Figure 3). Similar overlapping clustering results have been reported previously for a smaller dataset from California [12].
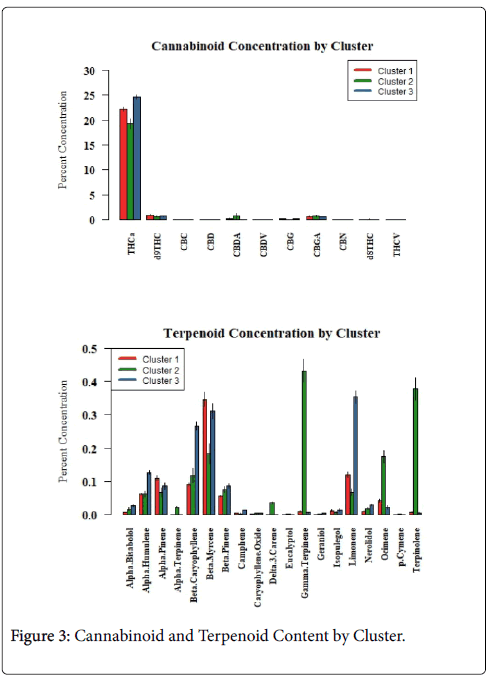
Figure 3: Cannabinoid and Terpenoid Content by Cluster.
Narrowing our analysis to those cultivars within each terpenoid cluster represented by greater than three reps, we tabulated quantitative terpenoid value descriptors ± standard deviations see Supplemental data (Table 2). The terpenoid content values are not absolute values but are all relative to each other since all of the data were collected by our state-certified cannabis analytical testing laboratory using the same validated method. The distinction among the cluster chemotypes was most distinct for terpenoid cluster #2, ironically the cluster with the fewest members at 155 samples. Cluster #2 was characterized with the unmatched predominance of both γ- terpinene and terpinolene, yet either alone warranted the distinction to cluster #2, just as terpinolene-dominance was associated previously with cultivars like Jack Herer and Trainwreck [12]. Distinction between cluster #1 and cluster #3 mainly hinged on the predominance of β-myrcene in cluster #1 and b-myrcene plus limonene in cluster #3. Lynch et al. [21] and Hillig [9] both previously reported significantly more β-myrcene and terpinolene in NLDT than BLDT.
| Terpene | Cluster 1 | Cluster 2 | Cluster 3 |
|---|---|---|---|
| Alpha.Bisabolol | 0.007 ± 0.010 | 0.017 ± 0.024 | 0.026 ± 0.021 |
| Alpha.Humulene | 0.062 ± 0.037 | 0.063 ± 0.045 | 0.127 ± 0.062 |
| Alpha.Pinene | 0.110 ± 0.119 | 0.067 ± 0.064 | 0.087 ± 0.107 |
| Alpha.Terpinene | 0.001 ± 0.002 | 0.023 ± 0.010 | 0.001 ± 0.002 |
| Beta.Caryophyllene | 0.091 ± 0.062 | 0.118 ± 0.105 | 0.266 ± 0.126 |
| Beta.Myrcene | 0.345 ± 0.296 | 0.183 ± 0.142 | 0.313 ± 0.232 |
| Beta.Pinene | 0.056 ± 0.041 | 0.076 ± 0.039 | 0.087 ± 0.060 |
| Camphene | 0.006 ± 0.004 | 0.004 ± 0.004 | 0.013 ± 0.007 |
| Caryophyllene.Oxide | 0.002 ± 0.002 | 0.004 ± 0.004 | 0.005 ± 0.004 |
| Delta.3.Carene | 0.001 ± 0.003 | 0.035 ± 0.017 | 0.001 ± 0.002 |
| Eucalyptol | 0.001 ± 0.001 | 0.002 ± 0.002 | 0.001 ± 0.001 |
| Gamma.Terpinene | 0.009 ± 0.033 | 0.432 ± 0.167 | 0.006 ± 0.014 |
| Geraniol | 0.001 ± 0.002 | 0.002 ± 0.003 | 0.005 ± 0.006 |
| Isopulegol | 0.012 ± 0.041 | 0.007 ± 0.012 | 0.013 ± 0.042 |
| Limonene | 0.120 ± 0.115 | 0.068 ± 0.045 | 0.353 ± 0.195 |
| Nerolidol | 0.010 ± 0.008 | 0.018 ± 0.015 | 0.029 ± 0.019 |
| Ocimene | 0.042 ± 0.086 | 0.174 ± 0.095 | 0.022 ± 0.058 |
| p.Cymene | 0.000 ± 0.001 | 0.002 ± 0.003 | 0.001 ± 0.002 |
| Terpinolene | 0.007 ± 0.026 | 0.377 ± 0.161 | 0.005 ± 0.014 |
± values indicate standard Deviation.
Table 2: Quantitative Terpenoid Data (Percent Concentration) by Cluster.
Individual cultivars from each of the three terpenoid clusters were further interrogated across cultivators to demonstrate the degree of fidelity represented by cultivars within cluster chemoprofiles see Figure 4; Supplemental data (Table 3). The terpenoid profiles for all three selected cultivars, Pineapple Express representing terpenoid cluster #1, Golden Goat representing terpenoid cluster #2 and Gorilla Glue #4 representing terpenoid cluster #3, were qualitatively distinct yet varied to some degree in the absolute amounts of each of the terpenoids which we now know from previous reports are affected by both the age of the flowers at harvest and the particular horticultural approach [1].
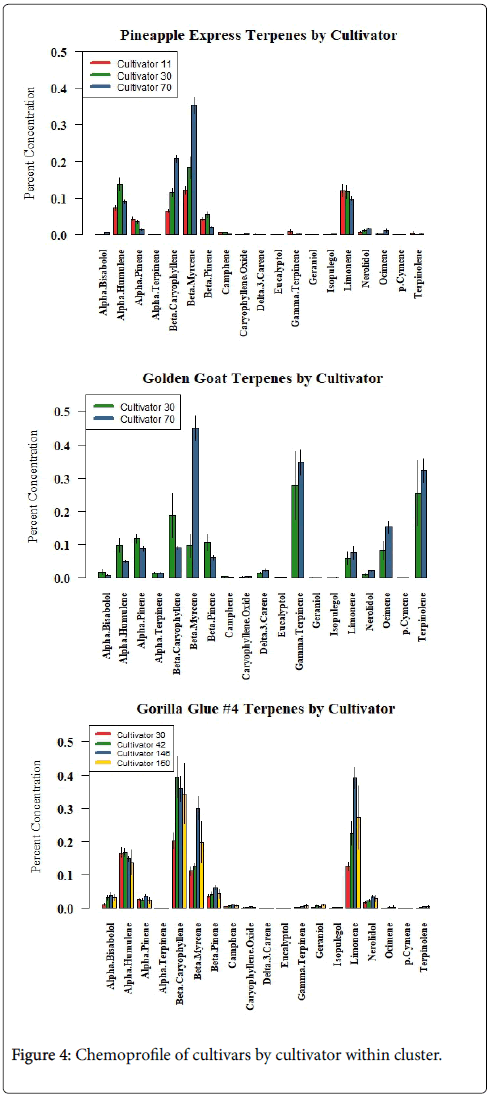
Figure 4: Chemoprofile of cultivars by cultivator within cluster.
| Blue Dream | Pineapple Express | Strawberry Lemonade | Casey Jones | Golden Goat | Super Lemon Haze | Girl Scout Cookies | Gorilla Glue #4 | Kosher Kush |
|---|---|---|---|---|---|---|---|---|
| 38 | 47 | 34 | 7 | 12 | 7 | 25 | 24 | 6 |
| 0.009 ± 0.008 | 0.005 ± 0.005 | 0.006 ± 0.006 | 0.001 ± 0.001 | 0.015 ± 0.011 | 0.007 ± 0.005 | 0.030 ± 0.011 | 0.041 ± 0.015 | 0.020 ± 0.011 |
| 0.053 ± 0.020 | 0.088 ± 0.027 | 0.031 ± 0.012 | 0.159 ± 0.068 | 0.076 ± 0.043 | 0.069 ± 0.050 | 0.119 ± 0.085 | 0.179 ± 0.060 | 0.093 ± 0.029 |
| 0.281 ± 0.136 | 0.024 ± 0.016 | 0.198 ± 0.100 | 0.037 ± 0.015 | 0.111 ± 0.018 | 0.044 ± 0.013 | 0.035 ± 0.014 | 0.032 ± 0.016 | 0.035 ± 0.010 |
| 0.001 ± 0.001 | 0.000 ± 0.001 | 0.001 ± 0.002 | 0.021 ± 0.010 | 0.020 ± 0.003 | 0.021 ± 0.007 | 0.000 ± 0.000 | 0.000 ± 0.000 | 0.001 ± 0.001 |
| 0.098 ± 0.056 | 0.147 ± 0.071 | 0.056 ± 0.035 | 0.273 ± 0.135 | 0.154 ± 0.110 | 0.108 ± 0.091 | 0.256 ± 0.210 | 0.418 ± 0.095 | 0.246 ± 0.093 |
| 0.247 ± 0.140 | 0.236 ± 0.135 | 0.365 ± 0.213 | 0.085 ± 0.038 | 0.419 ± 0.172 | 0.115 ± 0.045 | 0.236 ± 0.119 | 0.206 ± 0.110 | 0.303 ± 0.101 |
| 0.103 ± 0.044 | 0.030 ± 0.016 | 0.075 ± 0.042 | 0.053 ± 0.025 | 0.095 ± 0.044 | 0.064 ± 0.033 | 0.056 ± 0.025 | 0.053 ± 0.027 | 0.052 ± 0.018 |
| 0.006 ± 0.003 | 0.005 ± 0.002 | 0.005 ± 0.002 | 0.002 ± 0.001 | 0.004 ± 0.002 | 0.002 ± 0.001 | 0.010 ± 0.003 | 0.010 ± 0.004 | 0.011 ± 0.004 |
| 0.003 ± 0.002 | 0.003 ± 0.002 | 0.002 ± 0.001 | 0.005 ± 0.004 | 0.005 ± 0.001 | 0.003 ± 0.002 | 0.006 ± 0.002 | 0.004 ± 0.002 | 0.005 ± 0.002 |
| 0.001 ± 0.001 | 0.001 ± 0.001 | 0.002 ± 0.003 | 0.030 ± 0.018 | 0.027 ± 0.006 | 0.027 ± 0.006 | 0.000 ± 0.000 | 0.000 ± 0.001 | 0.001 ± 0.001 |
| 0.001 ± 0.001 | 0.000 ± 0.001 | 0.001 ± 0.001 | 0.003 ± 0.001 | 0.003 ± 0.001 | 0.003 ± 0.001 | 0.000 ± 0.001 | 0.000 ± 0.001 | 0.001 ± 0.001 |
| 0.003 ± 0.006 | 0.004 ± 0.008 | 0.007 ± 0.022 | 0.424 ± 0.157 | 0.427 ± 0.074 | 0.516 ± 0.256 | 0.004 ± 0.004 | 0.005 ± 0.005 | 0.004 ± 0.001 |
| 0.001 ± 0.002 | 0.000 ± 0.001 | 0.001 ± 0.001 | 0.002 ± 0.004 | 0.001 ± 0.001 | 0.001 ± 0.000 | 0.002 ± 0.002 | 0.007 ± 0.006 | 0.001 ± 0.001 |
| 0.002 ± 0.004 | 0.001 ± 0.001 | 0.002 ± 0.001 | 0.003 ± 0.002 | 0.002 ± 0.001 | 0.002 ± 0.002 | 0.002 ± 0.002 | 0.003 ± 0.001 | 0.003 ± 0.002 |
| 0.045 ± 0.030 | 0.103 ± 0.039 | 0.062 ± 0.035 | 0.036 ± 0.012 | 0.070 ± 0.021 | 0.064 ± 0.021 | 0.300 ± 0.111 | 0.306 ± 0.136 | 0.301 ± 0.107 |
| 0.012 ± 0.008 | 0.013 ± 0.007 | 0.015 ± 0.010 | 0.030 ± 0.015 | 0.022 ± 0.005 | 0.009 ± 0.005 | 0.027 ± 0.006 | 0.034 ± 0.011 | 0.018 ± 0.019 |
| 0.007 ± 0.004 | 0.007 ± 0.017 | 0.008 ± 0.007 | 0.210 ± 0.116 | 0.170 ± 0.034 | 0.203 ± 0.081 | 0.004 ± 0.002 | 0.003 ± 0.003 | 0.004 ± 0.001 |
| 0.000 ± 0.001 | 0.000 ± 0.000 | 0.000 ± 0.000 | 0.001 ± 0.001 | 0.001 ± 0.001 | 0.002 ± 0.001 | 0.000 ± 0.000 | 0.000 ± 0.000 | 0.001 ± 0.001 |
| 0.003 ± 0.005 | 0.003 ± 0.005 | 0.005 ± 0.016 | 0.370 ± 0.162 | 0.397 ± 0.069 | 0.477 ± 0.268 | 0.004 ± 0.003 | 0.004 ± 0.004 | 0.003 ± 0.001 |
± values indicate standard Deviation.
Table 3: Quantitative Terpenoid Data (Percent Concentration) for Selected Cultivars.
And in rare instances, flower samples for an individual cultivar, for example Gorilla Glue #4, were found represented in both terpenoid cluster #1 and cluster #3 see Supplemental data (Table 4). Upon further analysis of the terpenoid data, one can see that again the terpenoid pattern is maintained for the cultivar, yet the absolute values for any given terpenoid can vary dramatically see Figure 5.
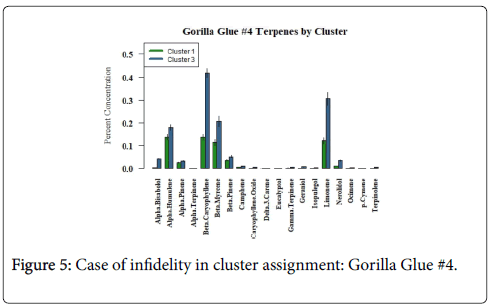
Figure 5: Case of infidelity in cluster assignment: Gorilla Glue #4.
| Terpenoid | Cluster 1 | Cluster 3 |
|---|---|---|
| n= | 18 | 24 |
| Alpha Bisabolol | 0.00 ± 0.00 | 0.04 ± 0.01 |
| Alpha Humulene | 0.14 ± 0.05 | 0.18 ± 0.06 |
| Alpha Pinene | 0.02 ± 0.01 | 0.03 ± 0.02 |
| Alpha Terpinene | 0.00 ± 0.00 | 0.00 ± 0.00 |
| Beta Caryophyllene | 0.14 ± 0.05 | 0.42 ± 0.09 |
| Beta Myrcene | 0.11 ± 0.06 | 0.21 ± 0.11 |
| Beta Pinene | 0.04 ± 0.01 | 0.05 ± 0.03 |
| Camphene | 0.01 ± 0.00 | 0.01 ± 0.00 |
| Caryophyllene Oxide | 0.00 ± 0.00 | 0.00 ± 0.00 |
| Delta 3 Carene | 0.00 ± 0.00 | 0.00 ± 0.00 |
| Eucalyptol | 0.00 ± 0.00 | 0.00 ± 0.00 |
| Gamma Terpinene | 0.00 ± 0.00 | 0.01 ± 0.01 |
| Geraniol | 0.00 ± 0.00 | 0.01 ± 0.01 |
| Isopulegol | 0.00 ± 0.00 | 0.00 ± 0.00 |
| Limonene | 0.12 ± 0.05 | 0.31 ± 0.14 |
| Nerolidol | 0.01 ± 0.00 | 0.03 ± 0.01 |
| Ocimene | 0.00 ±0.00 | 0.00 ± 0.00 |
| p-Cymene | 0.00 ± 0.00 | 0.00 ± 0.00 |
| Terpinolene | 0.00 ± 0.00 | 0.00 ± 0.00 |
± values indicate standard Deviation.
Table 4: Gorilla Glue #4 Terpenoid Data (Percent Concentration) by Cluster.
As mentioned earlier, there were 40 cannabis samples that fell outside of the dominant type I CBDA/THCA ratio. Thirty-two of those samples were type II with CBDA/THCA ratios between 0.65 to 2.03 and the other eight were type III or hemp-like by cannabinoid ratio. The 32 samples were split between terpenoid cluster #1 and terpenoid cluster #2. The individual terpenoid concentration averages for the 32 samples, labeled as NLDT in Figure 6, are shown next to the terpenoid averages for all of terpenoid cluster #1 and #2. The individual terpenoid averages for the other 8 samples outside of type I dominance and originally found within terpenoid cluster #3 are shown labeled as hemp in Figure 6 in comparison with terpenoid averages for all of terpenoid cluster #3.
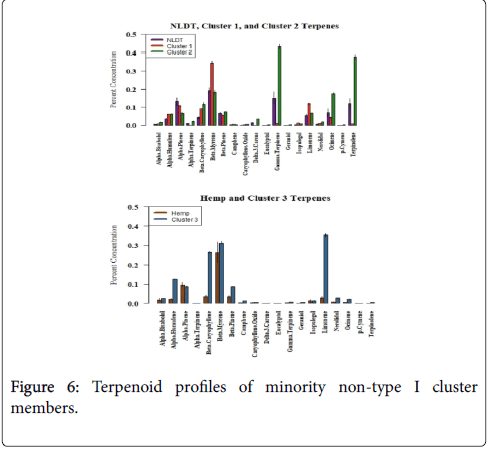
Figure 6: Terpenoid profiles of minority non-type I cluster members.
The terpenoid content in concert with the inherent cannabinoids of any particular cannabis cultivar plays an important role in the observed pharmacological effect [7]. In this study, we have shown that while terpenoid chemoprofile patterns can be unique for a particular cannabis cultivar, the absolute amounts of any given terpenoid can vary dramatically. The observed terpenoid analysis is likely influenced by genetics, epigenetics, the growing environment, time of harvest and the curing protocol.
While some have previously reported that chemoprofile data from replicate samples of the same cannabis cultivar do not necessarily cluster together by PCA, demonstrating the inherent variability in the observed chemical fingerprint even within the same cultivar in a restricted geographic region [17]. Others have shown that replicately grown batches of the same cannabis cultivar produce remarkably consistent chemoprofiles [11] and that the three distinct genetic groups of BLDT, NLDT and hemp also show distinct terpenoid profiles overall [21]. In this study, we have shown that in the artificially restricted geographic region of Nevada that cannabis cultivars remain remarkably consistent for terpenoid profiles even across different cultivators and cluster into three groups.
It is interesting that for the past 70 plus years of covert cannabis breeding, primarily selecting for high THC content, the diversity and prevalence of terpenoids has seemingly been maintained as was observed in the minority cannabinoid type III group of eight samples represented in the terpenoid profile of cluster #3 in this study. Now that the terpene synthase genes and transcriptome have been described for Cannabis sativa L., focused marker-assisted breeding programs will be able to modulate terpenoid content and create cultivars with standardized terpenoid profiles with the ratio of CBDA/THCA desired [25] and start to finally address the long taxonomically-neglected cannabis plant [26].
Future data analytic studies should take care to start with established stable genetic fingerprints of all cultivars included with precise note-taking on growth conditions to help understand any inherent future variability in testing data.
The authors wish to thank and acknowledge the analytical analyses performed at Digipath Labs by Shannon Tholson and Alyssa Everett.
No competing financial interests exist for any of the authors.
